Reports and Extracts
REPORTS/EXTRACTS
snapPacking provides options for downloading your data as spreadsheets. This allows you to leverage the powerful data analysis tools of products like Microsoft Excel.
Report filters
When you select a report, you will be presented with a selection for report filters. These can be used to filter the data that will be extracted. This is particularly important if you are sending this data to third parties. It also reduces the amount of data to be downloaded. NB - these filters do not apply to the refreshable version (the refreshable version has its own set of filters).
Most parameters support multiple values. If no value is entered, this is considered to be all.
Tip
Start typing the name of your parameter value and the dropdown list will be filtered to this. By default, the list will show the top 100 values so may look like your value is not there.... just start typing the name.
Downloading an extract
Spreadsheets downloaded from snapPacking typically contain two sheets: a Data sheet and a Pivot sheet.
- The
Datasheet is a big list of all of your data. - The
Pivotsheet will contain a pivot table based on the data sheet. You can add/remove columns from this pivot table based on what you would like to see.
To refresh the data, you must download the extract again.
Refreshable spreadsheets
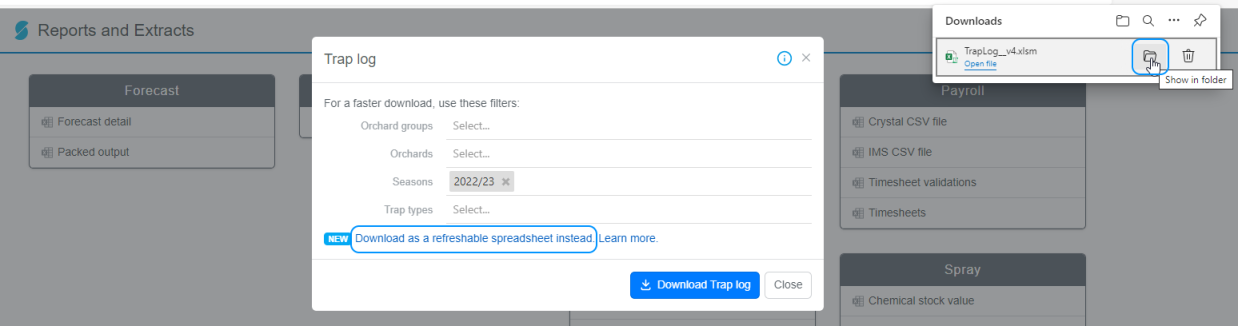
If you want to keep your pivot table format, you can Download as a refreshable spreadsheet instead, this will keep your pivot table format. See Refreshable spreadsheets for more detail.
Tip
All grids can be copied and pasted into Excel too
Common issues, FAQs
Dates are adding as Years, Quarters and Month
If you add a date and it has added 3 columns (years, quarters and month), right click on the date in the pivot table and select "Ungroup".
Unwanted subtotals
When adding columns, there are a lot of rows as there are subtotals. You can turn these off by right clicking on the column and unticking the "Subtotal" for this column.
Amounts are not correct
If you add an amount to the pivot table, by default it goes into the "Values" section and "Sums" the amount
- Does it make sense for this to be summed? Should it be in the "Row" section instead? If so, drag the column from the "Values" section to the "Rows" section
- Should this amount have a different calculation, eg count, min, max, average? If so, in the "Values" section, click on the down arrow next to your field and select "Value field settings". Choose the correct calculation.
Useful website for working with Excel pivot tables
Refreshable spreadsheets - changing the database to the previous season
Refreshable spreadsheets - prompting for a password
If you are opening a refreshable spreadsheet for the first time on a computer, or have changed your password, you will be prompted for your password again. See Refreshable spreadsheets for "Getting started".
Refreshable spreadsheets - no filters
Microsoft has introduced extra security which has resulted in issues with the filters when you downloaded a new refreshable spreadsheet (nothing is in the filter drop downs). To get around this, when you click to "Download as a refreshable spreadsheet", in the downloads prompt, click "Show in folder"
Right click on the file and select "Properties". Tick "Unblock"
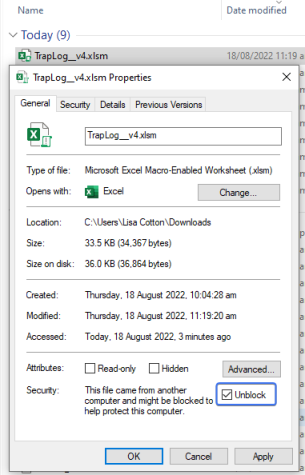
Click "OK", double click to open the file, continue as normal.